
By Robert Balgac, Founder, Black Swan Insurance Group | October 9, 2026
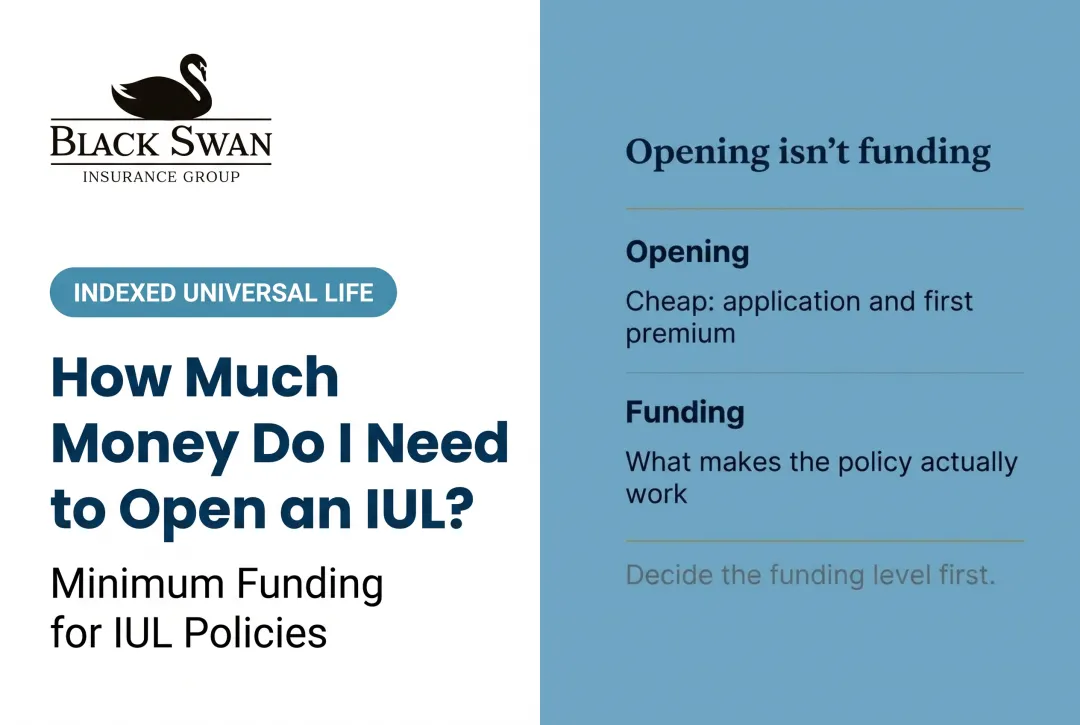
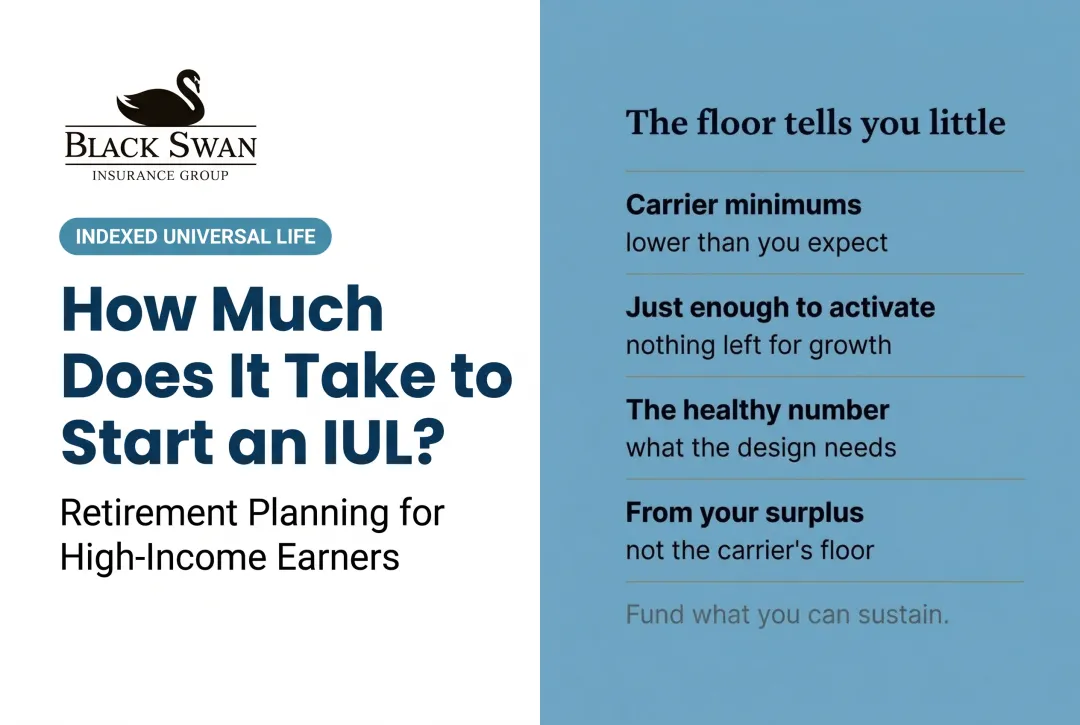
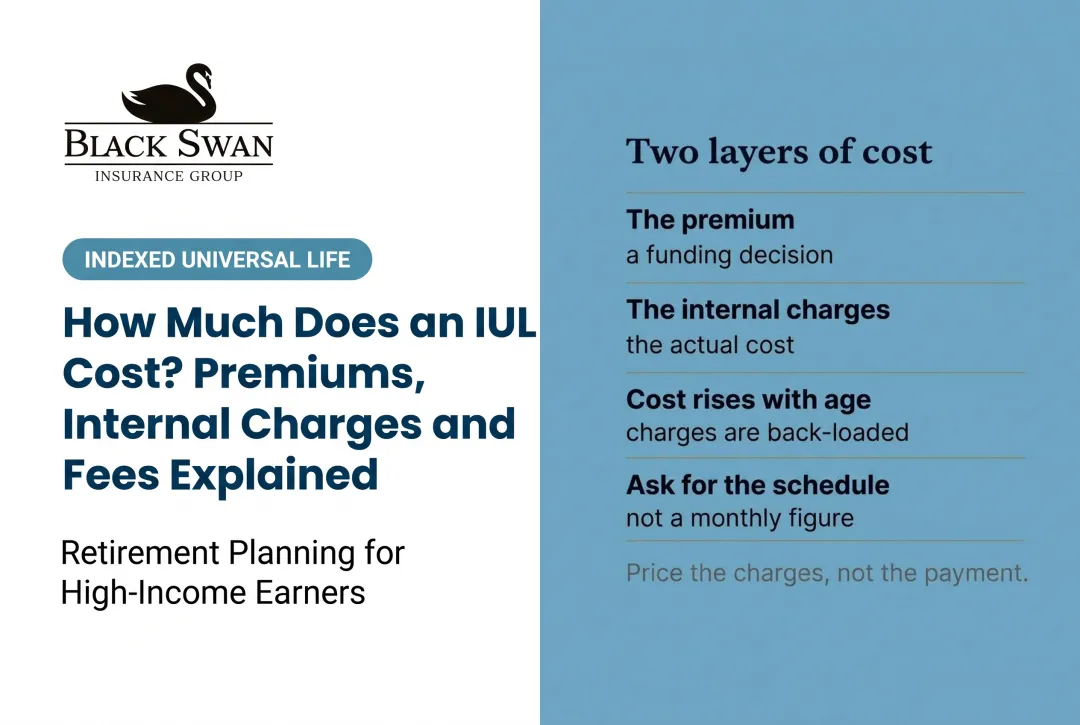
If you earn $150K+ and you are trying to work out what an indexed universal life policy costs per month, the first thing worth absorbing is that the question has a flaw built into it. An IUL premium is not a price. It is a funding decision.
A car has a price. A term policy has something close to a price. An IUL has a range — bounded at the bottom by the minimum that keeps coverage in force and at the top by the IRS limit that preserves its tax treatment — and where you land inside that range is the single most consequential choice you will make about the contract. Two people the same age, same health, same carrier, same $1 million death benefit can pay wildly different monthly amounts and both be right.
The short answer: Illustrative carrier examples for $1 million of coverage run roughly $545 to over $1,200 a month depending on age, sex and underwriting class — but that figure is an annual planned premium divided by twelve, not a bill. Your real number comes from underwriting, and the more important question is not "what is the cheapest payment" but "what payment can I sustain for decades without starving the policy."
Key Takeaways
- Illustrative monthly premiums range from roughly $545 to over $1,200, driven by age, coverage and health class
- Age, tobacco use, death benefit amount, benefit option, riders and underwriting class all move the number
- A lower planned premium leaves less funding cushion and raises future lapse risk
- The payment amount alone tells you almost nothing about long-term performance
- The right budget balances protection, cash flow, liquidity and policy sustainability
- IUL is not automatically better than term, whole life or retirement accounts
What the Numbers Actually Look Like
Search "average IUL cost" and you will find plenty of figures. None of them can predict what you will pay once underwriting reviews your health, your state's rules and your carrier's pricing.
Three ways misreading price causes real damage: budgeting only for the initial planned premium while ignoring rising insurance charges later; choosing a premium too low to provide adequate protection or sustain the policy; and buying permanent coverage when the actual need is temporary income protection, which term handles far more cheaply.
Illustrative Carrier Examples
| Applicant Profile | Death Benefit | Annual Premium | Monthly Equivalent |
|---|---|---|---|
| Age 45, female, preferred nontobacco (2025) | $1,000,000 | $6,540 | $545.00 |
| Age 45, male, preferred nontobacco (2025) | $1,000,000 | $7,210 | $600.83 |
| Age 54, male, preferred nontobacco (2024) | $1,000,000 | $10,300 | $858.33 |
| Age 64, female, preferred nontobacco (2024) | $1,000,000 | $14,430 | $1,202.50 |
A 2025 carrier illustration from Mutual of Omaha provides the age-45 examples for $1 million of coverage with preferred nontobacco underwriting. A separate 2024 Mutual of Omaha comparison provides the age-54 and age-64 figures.
The policy designs differ between those two illustrations, so do not read the gap as a pure age effect — underwriting class, benefit option and funding assumptions all contribute. And each figure is an annual illustrated premium divided by twelve, not a standalone monthly billing quote. It may reflect a planned premium, a minimum to keep coverage in force, or a carrier's internal target premium. Those are three different things.

Your Monthly Payment Is Five Things
- Cost of insurance — pays for the death benefit protection
- Administrative charges — recurring fees for maintaining the policy
- Premium loads — a percentage deducted from each payment before it reaches cash value
- Rider charges — costs for optional benefits
- Cash value allocation — whatever remains, credited per your chosen index strategy
Two policies with identical death benefits and identical monthly payments can perform very differently, because carriers apply different charges, caps, participation rates and guarantees. The payment amount tells you almost nothing on its own.
What Drives Your Number
Age, Health and Coverage
Age matters more than almost anything. Cost of insurance rises with age because mortality risk rises, so applying later means a larger insurance charge inside every payment.
Health and lifestyle set your underwriting class, which can swing the premium substantially: medical history and current prescriptions, family history, occupation and high-risk hobbies such as aviation, and tobacco or nicotine use including how recently you stopped.
Death benefit amount and option. A level death benefit (Option A) keeps the payout fixed at the face amount. An increasing death benefit (Option B) adds accumulated cash value on top, so it typically needs higher ongoing funding to stay on track.
Four Premium Terms People Conflate
- Minimum premium — the smallest payment keeping coverage in force under a limited no-lapse guarantee. Not designed to build cash value.
- Planned premium — the schedule you set up front; many carriers allow adjustment from year two.
- Target premium — a carrier funding benchmark tied to product design. Not the same as cost of insurance.
- Overfunding — paying above the planned premium to build cash value faster while staying inside IRS limits so the policy does not become a Modified Endowment Contract.
The Charge Schedule You Should Demand
Example terms from one carrier's 2025 product:
| Charge | Example Terms |
|---|---|
| Premium load | 4.5% deducted from each payment |
| Administrative fee | $8 monthly plus a per-$1,000 face amount charge |
| Surrender charge period | 14 policy years |
| Cost of insurance | Monthly deduction, increases with age |
| Indexed-strategy charge | Varies by selected index account |
Caps, participation rates, spreads and floors are not direct fees, but they decide how much index growth is credited after charges come out. A 9.25% cap with 100% participation behaves very differently from a 6.5% cap with 140% participation on the same index return — and neither is obviously better until you model it.

Costs Beyond the Premium Line
- Recurring charges deducted from cash value every month, in every year
- Opportunity cost of premium dollars not deployed elsewhere
- Policy loan interest on amounts borrowed against cash value
- Tax consequences if a policy with an outstanding loan lapses — the forgiven balance can become taxable income with no cash received
Compare the guaranteed column against the non-guaranteed column side by side. Guaranteed figures reflect the worst scenario the contract permits. Non-guaranteed figures assume today's crediting rates never change. Treat the second set as a stress-test input and size premiums so the policy still works nearer the first.
An illustration is a model, not a guarantee.
The Ultimate IUL Blueprint
Before you set a monthly number, the Blueprint covers what the design has to survive: funding levels, caps and charges, the MEC line, loan timing, and what to demand from an illustration before you sign.
What the Critics Get Right
The strongest fair criticism of IUL pricing is that it is opaque by construction. Cost of insurance rises each year with age, carriers retain discretion over caps and participation rates within contract limits, and the headline premium conceals a stack of internal charges that the buyer rarely sees itemised unless they ask.
That is accurate. The charge schedule exists, but almost nobody is handed it unprompted.
What the criticism misses is that this is an argument for demanding the ledger, not for dismissing the product. Ask for the year-by-year schedule of premiums, charges, cash value, surrender value and death benefit under both guaranteed and current assumptions. It is a routine request. How someone reacts to it tells you most of what you need to know about them.
A great IUL is engineered. A bad IUL is sold.
Cheap Versus Sustainable
"Low-cost" should not mean "lowest monthly payment." It should mean sustainable and appropriately funded for the job.
- Lower planned premium: less funding margin, more sensitivity to rising charges or weak index credits, and a thin cushion if results disappoint for several consecutive years
- Higher planned premium: faster cash value build and more support against future charge increases — but no guarantee of better returns, and more strain on cash flow or liquidity you may need elsewhere
A policy that looks affordable in year one can become expensive in year fifteen if it was underfunded from the start. Research on universal life persistency has flagged exactly this. According to WTW's 2024 persistency analysis, actual returns falling short of illustrated projections can disrupt planned loans or withdrawals and meaningfully increase lapse risk.
Riders and guarantees add protection and add cost. More death benefit than you need inflates the premium requirement without adding anything to your plan.
Compare both designs over the same horizon: guaranteed cash surrender value at years 10, 20 and 30; death benefit under guaranteed and current assumptions; the impact of any planned loans or withdrawals; and projected lapse risk if credited rates come in below illustration.

How to Set Your Own Budget
- Separate the permanent need from the temporary one — debts, education costs and income replacement may be better served by term coverage
- Review your real monthly surplus after emergency reserves, high-interest debt, retirement contributions and taxes
- Stress-test the premium against reduced income, business volatility, retirement and several years of below-illustration performance
- Request two funding scenarios — a conservative sustainable premium and a higher cash-value-focused design — and compare guaranteed values in both
- Compare against alternatives, including term, whole life, 401(k), Roth and taxable investing
Five questions before you buy: what is the guaranteed death benefit and cash value at each review year; which charges are locked and which can the carrier change, and how are caps and participation rates set; what happens if I reduce, skip or stop premiums; how do withdrawals, loans and loan interest affect the death benefit and my taxes; and how often will the policy be reviewed after I buy it?
Stronger Fit
- Earning $150K+ with surplus cash flow that survives a weak year, not just a strong one
- A genuine permanent insurance need alongside the accumulation goal
- Emergency reserves and higher-priority savings already handled
- Willing to fund at a sustainable level rather than the cheapest or the richest
- Willing to review performance and charges annually
Weaker Fit
This strategy is not appropriate for everyone. Do not buy if:
- You have not maxed lower-cost tax-advantaged accounts
- You need short-term access to the money
- You do not actually need permanent coverage — term is cheaper and simpler
- Income is variable enough that a multi-decade schedule is guesswork
- You would choose the design based on the smallest number on the page

Risks to Understand Before You Commit to a Monthly Figure
- Fixating on the initial premium instead of the long-term funding requirement is the classic error.
- Treating illustrated returns as guarantees. Favourable tax treatment on access depends on policy design, funding and IRS rules.
- Buying more death benefit or more riders than the plan requires inflates cost with no benefit.
- Assuming the 0% floor protects cash value. Fees, insurance charges, loans and underfunding can still erode value or cause a lapse in a zero-credit year. Zero is your hero in a down year — but the floor applies to the credit, not to the charges.
- Cost of insurance rises with age. A design that works at 45 has to still work at 70.
- Surrender charges can run well over a decade, making an early exit expensive.
Find Out Where You Actually Stand
This starts with the Tax-Free Wealth Blueprint Fit Review. If you earn $150K+ and you want a real monthly number rather than a range from a search result, we review the underwriting class you are likely to receive, compare death benefit options and funding levels across carriers, and model performance under conservative crediting assumptions rather than optimistic ones. We do not promise a premium before underwriting, because that is not how this product works. If IUL does not fit, we will tell you that too.
Frequently Asked Questions
How much does an IUL cost per month?
It varies by age, health class, tobacco use, coverage amount and design. Illustrative ranges run roughly $545 to $1,200+ per month for $1 million of coverage, but personalised underwriting sets your actual figure.
Is an IUL really worth it?
It can be, for someone who needs permanent coverage, can fund it consistently for decades and values the cash value flexibility. Costs, caps, charges and lapse risk need honest evaluation first, alongside term and whole life.
Can IUL premiums change over time?
Your planned premium is flexible and adjustable, but the underlying policy charges rise as you age. Insufficient funding can force higher payments later just to keep coverage active.
What happens if I stop paying?
Available cash value can temporarily cover ongoing charges, but the policy can lapse once that value runs out. Outstanding loans or withdrawals at lapse may create taxable gain.
What fees are included?
Cost of insurance, administrative fees, premium loads, surrender charges, rider fees and loan interest. Exact amounts and guarantees vary significantly by carrier — get the schedule in writing.
Is IUL cheaper than whole life or term?
Term is generally the lowest-cost option for temporary protection. Whole life and IUL are both permanent and differ in guarantees, premium flexibility and cash value mechanics. Comparisons depend on the specific designs.
Sources
- Mutual of Omaha — 2025 indexed universal life illustration
- Mutual of Omaha — 2024 indexed universal life comparison
- WTW — Indexed universal life persistency risks abound
- NAIC — Life Insurance Illustrations
Disclosure: This article is educational and is not personal tax, legal or investment advice. Indexed universal life is life insurance first. Premium figures shown are illustrative carrier examples for specific profiles and are not quotes; your cost depends on underwriting, state, carrier and design. Illustrated values are not guarantees; actual results depend on policy terms, crediting, costs and funding. Any potential tax-advantaged access depends on the policy being properly structured, funded and managed. Actual results depend on policy design, carrier, crediting options, caps, participation rates, expenses, funding and ongoing management. This strategy is not appropriate for everyone. Policy loans and withdrawals reduce cash value and the death benefit, and can create tax consequences if the policy lapses or becomes a modified endowment contract. Consult your own tax, legal and financial professionals for advice specific to your situation.
And remember, it's not what you earn, it's what you keep… enjoy the ride.