
By Robert Balgac, Founder, Black Swan Insurance Group | October 7, 2026
Every IUL comes with a chart that appears to show exactly how the policy performs over the next 20, 30, even 50 years. Buyers treat it as a forecast. It is a model, and the assumptions underneath it can be revised by the carrier without anything in your contract being breached.
If you earn $150K+ and someone has put an illustration in front of you, learning to read it is the highest-value hour you will spend on this decision. Not because the chart is dishonest — it is usually compliant and accurate — but because the numbers that matter are not the ones your eye goes to.
The short answer: An IUL chart has two columns that behave completely differently. The guaranteed column is contractually binding and looks modest. The non-guaranteed column reflects today's caps, participation rates and charges, all of which can change. Read them side by side, demand a lower-crediting version, and judge the policy on what survives the conservative scenario.
An illustration is a model, not a guarantee. The rate on the cover is the least binding number in the document.
Key Takeaways
- A chart projects possible outcomes, not guaranteed cash value or retirement income
- Review guaranteed and non-guaranteed columns together, never the best case alone
- A 0% floor protects against negative index credits; it does not stop charges reducing cash value
- Request a lower-crediting-rate version before deciding anything
- Treat IUL as one piece of a plan, not a substitute for reserves or employer retirement accounts
What the Chart Actually Represents
An IUL chart is a policy illustration showing how premiums and insurance charges, assumed credits, cash value, death benefit, surrender value and potential loans may change year by year.
Here is what buyers skip: this is an insurance contract first. Part of every premium pays for the death benefit and expenses. Only the remainder has a chance to build cash value.
You are not invested in the S&P 500. The insurer applies a crediting formula bound by the caps, floors and participation rates in your contract. Index performance influences the credit; it does not equal it.
Design inputs are not derived results. Face amount and premium schedule are parameters you control. Projected cash value and lapse risk are outputs that depend on those choices and on the insurer's assumptions.
Values are specific to the carrier, product version and your underwriting. A generic online example tells you nothing about your policy. Review the signed illustration, the specifications page and the contract itself.

How to Read It
Treat it as connected inputs and outputs, not a single return number. Change one input and every downstream column moves.
Funding assumptions first: planned premium and frequency, funding duration, face amount and death benefit option, riders. Ask whether the design is for protection, accumulation or both — that changes how you should judge everything else.
Flexible premiums are not optional premiums. You may be able to reduce or skip a payment, but the contract still needs enough cash value to cover charges. Skip too often, or underfund from the start, and you accelerate lapse risk. Higher funding builds value faster, improves early surrender value, extends longevity under adverse scenarios, and reduces the net amount at risk — which lowers your cost of insurance.
Crediting assumptions next: the index, the method (often annual point-to-point), the measurement period, and the modifiers — cap, floor, participation rate, spread, sometimes a bonus or fixed account.
| Scenario | Index return | Cap | Participation | Credited (before charges) |
|---|---|---|---|---|
| Strong year | 12% | 9% | 100% | 9% |
| Modest year | 4% | 9% | 100% | 4% |
| Down year | −8% | 9% | 100% | 0% (floor applies) |
Index return, credited interest and net policy growth are three different numbers. The chart may show a 9% credit while actual cash value growth, after cost of insurance and administrative charges, is far lower or negative.

Then the value columns: illustrated cash value, surrender value, death benefit, premium outlay, cost of insurance and other charges, and any loan balance. Cash value and surrender value are separate lines — terminate early and surrender charges can leave you with materially less than the cash value column suggests. Check years 10, 20 and 30, not only the final year. The trajectory matters more than the endpoint.
The Ultimate IUL Blueprint
If you are holding an illustration right now, the Blueprint covers what the design has to survive: funding levels, caps and charges, the MEC line, loan timing, and exactly what to demand before you sign.
What the Critics Get Right
The criticism that IUL is sold on illustrations most buyers cannot interpret is simply true, and the industry has been told so by its own regulators — repeatedly.
Actuarial Guideline 49 arrived in 2015 because illustrated rates had become competitive marketing rather than reasonable projection. AG 49-A followed. Then the 2023 revisions. Three corrections in under a decade is not the record of a disclosure regime that was working.
Where the criticism overreaches is in treating the chart as worthless. It is a genuinely useful decision tool — if you read the guaranteed column, stress-test the assumptions, and judge on what survives the bad scenario rather than what the good one promises.
The Stress Tests That Matter
Floor, cap, participation rate and spread define the crediting range. Caps and participation rates are frequently non-guaranteed and can be adjusted going forward within contract limits.
Under AG 49-A, which governs how carriers may illustrate these policies, the benchmark account assumes a 0% annual floor with 100% participation — a regulatory specification, not a universal guarantee.
For policies sold on or after 1 April 2026, carriers must show an alternate ledger beside the illustrated-scale ledger with equal visual weight, so a conservative scenario sits next to the optimistic one, per the NAIC's AG 49-A guideline. Ask for it even if your policy predates the requirement.

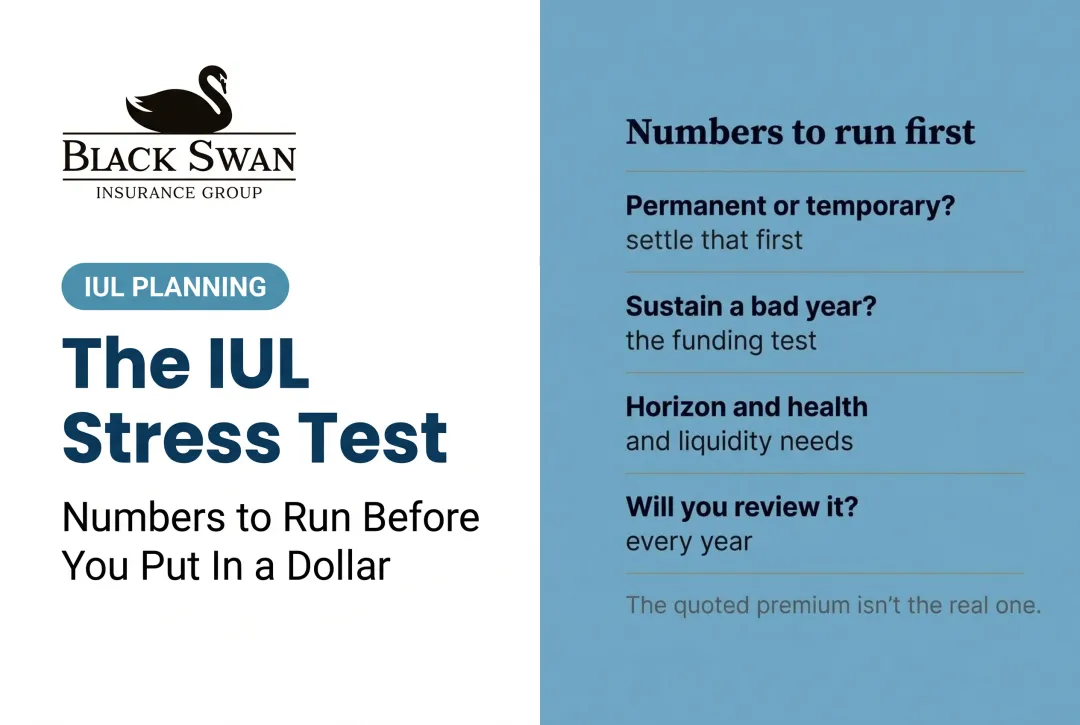
Run the illustration five ways: planned premiums at the assumed rate; reduced premiums at the same rate; missed premiums for one or more years; lower crediting with planned premiums; and higher charges combined with reduced funding.
A policy can show positive credited interest while net cash value falls, because charges are deducted separately from the crediting calculation. Rising cost of insurance, rider charges, loan interest and administrative fees all erode value independent of index performance.
Research on universal life found lapse rates rose across policy years between 2015–2018 and 2019–2020, though it did not isolate underfunding as the cause, per the SOA/LIMRA lapse and surrender experience study. Funding discipline matters at least as much as the crediting rate you were sold.
On loans: withdrawals and loans both reduce cash value and can reduce the death benefit, and loans accrue interest that compounds if unpaid. A loan outstanding when the policy lapses or is surrendered can create a taxable event even where little or no cash was received. For a non-MEC contract, loans taken while the policy remains in force are generally not treated as distributions — protection that disappears the moment the contract terminates with debt outstanding, per ThinkAdvisor's Tax Facts guidance.
The loan is not the problem. The unmanaged loan is the problem.
Compare illustrations three ways: no distributions, planned withdrawals, and loans — each against both favourable and unfavourable crediting.
Comparing Proposals Without Being Misled
Hold these constant across any two proposals: death benefit, premium budget, funding period, underwriting assumptions and distribution strategy.
Comparing illustrated rates alone is misleading. Different caps, participation rates, charges and loan provisions produce very different outcomes at the same assumed rate. Judge on net cash value, surrender value, death benefit and projected longevity — and ignore the single highest projected account value on the page.
A complete illustration should identify the illustration date, carrier and product version, state availability and assumed index, crediting method, premiums and riders, charges, loan type and death benefit option. Request guaranteed and non-guaranteed columns together with full expense detail and any supplemental ledger. NAIC Model #582 sets a baseline, but state rules differ — confirm what governs where you live.
Reading It Again Every Year
Chart review is not only a pre-purchase step. Once the policy is in force it becomes the maintenance routine: compare actual credited interest against the original illustrated assumptions, check whether premiums, allocations or loans need adjusting, confirm the death benefit design still matches the goal, and involve a tax or legal adviser whenever loans or distributions are planned.

A review should also be willing to conclude the policy no longer fits — because of funding capacity, time horizon, health changes, liquidity needs, or a shift in what your protection actually requires.
Stronger Fit
An IUL is worth modelling if you:
- Earn $150K+ with surplus cash flow after reserves, debt and maxed retirement contributions
- Have a genuine permanent protection, estate-liquidity or business need
- Have a long horizon and will fund consistently
- Will review the chart against actual performance every year
Weaker Fit
Not everyone should own one. Reconsider if you:
- Cannot sustain the funding the illustration assumes
- Need liquidity in the near term, where surrender charges will hurt
- Only need protection for a defined period — term is cheaper and sufficient
- Have an unclaimed employer match or thin emergency reserves
- Are deciding on the strength of the non-guaranteed column
Risks to Understand Before You Sign
- Treating the illustration as a promise rather than a scenario is the root error behind most of the rest.
- Equating index return with credited rate, and credited rate with net growth. Three different numbers.
- Assuming a 0% floor prevents decline. It does not; charges continue.
- Overlooking surrender charges when comparing early-year values.
- Assuming "flexible" means optional. Underfunding is the leading cause of failure.
- Lapsing with a loan outstanding can produce a tax bill with no cash received.
When a policy drifts from its illustration — through underfunding, prolonged low crediting, rising charges, heavy loans or early surrender — the consequences compound: slower accumulation, reduced surrender value, higher premiums needed to stay on track, a reduced death benefit under some designs, lapse, and the tax bill that can follow.
Find Out Where You Actually Stand
This starts with the Tax-Free Wealth Blueprint Fit Review. If you are holding an illustration, bring it. We read the guaranteed column against the illustrated one, rerun the design at lower crediting and with missed premium years, show what the charges actually do to net value, and model the loan assumptions honestly. If the policy only works when everything goes right, we will tell you. If IUL does not fit your situation, we will tell you that too.
Frequently Asked Questions
Is an IUL chart a guarantee?
No. Only the contract's guaranteed values and provisions are guaranteed. Current, non-guaranteed assumptions and index-linked projections can change across the life of the policy.
What does the chart show?
Projected premiums, cash value, surrender value, death benefit and policy charges, plus possible loan activity, under both guaranteed and non-guaranteed assumptions.
Does a 0% floor mean the policy cannot lose money?
No. The floor applies to indexed interest crediting. It does not stop insurance costs, administrative charges, loans, withdrawals or underfunding reducing cash value.
Do IUL policies have cash value?
Yes. There is generally a cash value component that may receive interest under an index-linked formula, subject to caps, floors, participation rates and your contract terms.
What should I compare across charts?
Premiums, guaranteed and non-guaranteed values, caps, participation rates, crediting methods, charges, surrender value, death benefit, loan terms and lapse risk — together, holding the death benefit and premium budget constant.
Can the chart show retirement income?
It can model withdrawals or loans as a potential strategy. The real outcome depends on performance, funding discipline, charges, loan interest, tax rules and whether the policy stays in force.
Sources
- NAIC — Actuarial Guideline 49-A
- SOA/LIMRA — 2015–2021 universal life lapse and surrender study
- ThinkAdvisor Tax Facts — treatment of policy loans
- NAIC — Life Insurance Illustrations
Disclosure: This article is educational and is not personal tax, legal or investment advice. Indexed universal life is life insurance first. Illustration content, disclosure requirements and product availability vary by carrier and state; NAIC Model #582 sets a baseline that individual states may modify. Illustrated values are not guarantees; actual results depend on policy terms, crediting, costs and funding. Any potential tax-advantaged access depends on the policy being properly structured, funded and managed. Actual results depend on policy design, carrier, crediting options, caps, participation rates, expenses, funding and ongoing management. This strategy is not appropriate for everyone. Policy loans and withdrawals reduce cash value and the death benefit, and can create tax consequences if the policy lapses or becomes a modified endowment contract. Consult your own tax, legal and financial professionals for advice specific to your situation.
And remember, it's not what you earn, it's what you keep… enjoy the ride.