
By Robert Balgac, Founder, Black Swan Insurance Group | October 5, 2026
An IUL illustration shows what a policy could do under one specific set of assumptions. It is not a guarantee and it is not a retirement income projection. Yet most people leave the meeting believing the highlighted figure on page 12 is the number they are buying.
The document itself is honest. It contains the guaranteed column, the lapse year under those guarantees, and every charge. The problem is that nobody walks a buyer through the half of the page that is unflattering.
If you earn $150K+ and have an illustration in front of you, this is the order to read it in, what each column actually commits the carrier to, and the three scenarios that decide whether the design survives.
The short answer: Guaranteed and non-guaranteed columns tell completely different stories, and the same page can show a policy in force at year 40 under current assumptions and lapsed at year 22 under guaranteed ones. Credited interest applies only to eligible cash value, not to every premium dollar. A 0% floor blocks a negative index credit but not the cost of insurance, fees or loan interest. Read the guaranteed column first, calculate a real internal rate of return rather than a simple average, and stress-test a funding pause before you sign anything.
Key Takeaways
- Guaranteed and non-guaranteed columns are different stories — never treat the higher projection as a commitment
- Credited interest applies to eligible cash value, not to every premium dollar you paid
- A 0% floor blocks index losses; insurance costs and fees can still shrink cash value or trigger a lapse
- Judge fit on funding capacity, liquidity, insurability and how the design compares with simpler alternatives
- For an existing policy, ask for an in-force illustration — the original sales document is no longer relevant
Where the Premium Goes First
An IUL is permanent life insurance built around a death benefit and a cash-value account credited on an index-linked formula. Your money is never invested in the S&P 500 or any other index; the insurer credits interest based on how the index performed, subject to policy limits.
Not every premium dollar reaches the cash account. A portion covers the cost of insurance — mortality charges tied to age, health class and death benefit — plus premium loads, administrative fees and any rider charges. The remainder is eligible for crediting. Which is why "premium paid" and "amount growing" are rarely the same figure.
| Term | What it means |
|---|---|
| Floor | The minimum crediting rate, often 0%, limiting index-related losses — it does not erase policy charges |
| Cap | The maximum rate credited under a strategy, however well the index performs |
| Participation rate | The percentage of index growth counted before caps and floors apply |
| Crediting method | Annual point-to-point, monthly point-to-point or averaging — each produces different results from the same index |
The floor, cap and participation rate are declared by the carrier for each index segment, as set out in North American's guide to indexed universal life.
Those limits apply only to the credit. Charges come out whether the index is up or flat. A policy can post a solid index credit in the ledger and still show cash value falling that same year.

Premium is the fuel. Cash value is the tank. The charges are the engine burn. An illustration that only shows the tank filling is telling you half the story.
Reading the Document
Use an actual approved carrier document, or something clearly labelled hypothetical. Never a verbal pitch or a rounded figure on a slide.
Confirm the Design on the Cover Page
Insured's age, sex and underwriting class. Death benefit amount and option. Planned premium and premium duration. Riders attached. Index strategies selected, and total policy duration.
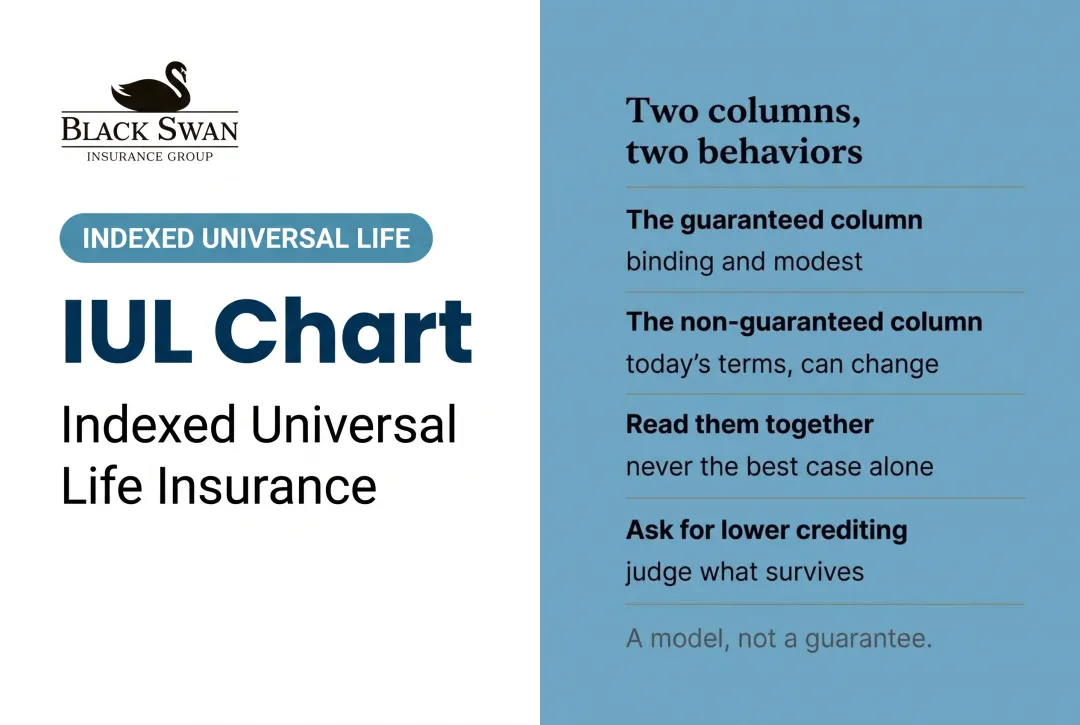
Guaranteed Versus Non-Guaranteed
This is where the confusion starts and where it gets expensive. Under the NAIC's Life Insurance Illustrations Model Regulation, insurers must clearly separate guaranteed elements — values locked in at issue — from non-guaranteed elements tied to current assumptions that can change.
- Guaranteed values are the contractual floor: the worst case the insurer must honour if premiums are paid as required
- Current values are scenario projections built on today's caps, participation rates and charges, and none of it is locked in
The part most buyers miss: an illustration can show the policy in force for 40 years under current assumptions and lapsing at year 22 under the guaranteed ones. Both numbers are on the same page, and only one of them is a promise.
Compare These, Year by Year
- Cumulative premiums paid
- Cash value
- Surrender value, after surrender charges
- Death benefit
- Loan balance and net cash value, where applicable
- Whether the policy remains in force
If you already own the policy, request an in-force illustration. It reflects actual performance to date rather than the original sales assumptions, and it is the only reliable picture of where you stand.
Calculate a Real Return
Do not divide total gain by the number of years — that overstates early performance and ignores compounding. Compare actual cash flows, premiums in and withdrawals out, against the projected cash surrender value using an internal rate of return. The IRR is a far clearer measure than any multi-year average.
A Worked Example
These figures are entirely hypothetical and for education only. Not a quote, a carrier projection or a promise of results. Your own illustration will differ by age, health, insurer and design.
Assumptions: insured age 45, preferred non-tobacco; $1,000,000 death benefit, increasing option shifting to level at retirement; $20,000 annual premium for 20 years; annual point-to-point with a 9% cap, 100% participation and a 0% floor; evaluated over 30 years.
| Policy year | Premiums paid | Cash value (current) | Cash value (guaranteed) | Surrender value | In force? |
|---|---|---|---|---|---|
| 5 | $100,000 | $92,000 | $71,000 | $78,000 | Yes, both scenarios |
| 10 | $200,000 | $238,000 | $164,000 | $221,000 | Yes, both scenarios |
| 20 | $400,000 | $710,000 | $310,000 | $710,000 | Yes current; at risk guaranteed |
| 30 | $400,000 | $1,150,000 | $0 (lapsed) | $1,150,000 | Yes current; lapsed guaranteed |

Look at year 30. The same document shows $1,150,000 and $0. That is not a trick — it is the honest range, and the whole purpose of the guaranteed column.
Three Scenarios Worth Studying
A strong index year. The index gains 18% in one segment. With a 9% cap the credit stops at 9%. The extra gain is not credited, whatever the participation rate.
A negative index year. The index drops 12%. The 0% floor prevents a negative credit, so cash value does not fall because of the index. Cost of insurance and administrative charges still come out, so the account can drop anyway.
A flat stretch. Several years of 2–3% index gains — entirely ordinary in real markets — may not generate enough credited interest to outpace rising insurance costs as the insured ages. This is usually where a policy starts demanding additional premium to stay on the original track.
What to Focus On
Not the highest illustrated number. The break-even point where cash value exceeds premiums paid, the guaranteed-column surrender value at your expected retirement age, and the lapse risk under conservative and guaranteed assumptions.
What the Critics Get Right
The criticism of IUL illustrations is largely fair, and meeting it directly is more useful than arguing.
Critics are right that these documents were historically used as sales instruments rather than disclosures, projecting rates nobody believed. They are right that comparing an illustrated 9% cap against the S&P 500's historical average is misleading, because the credit already excludes dividends and applies after caps and participation limits. And they are right that a buyer who anchors on the current column has been sold something the carrier never promised.
Where the criticism has aged is on the regulatory side. AG 49-A limits how optimistic an illustrated rate can be, capping it at the lesser of a historical rolling-period average or a percentage of the insurer's net investment earnings rate. That keeps these documents more grounded than they once were. It still does not guarantee the policy performs as shown — a guardrail is not a safety net.
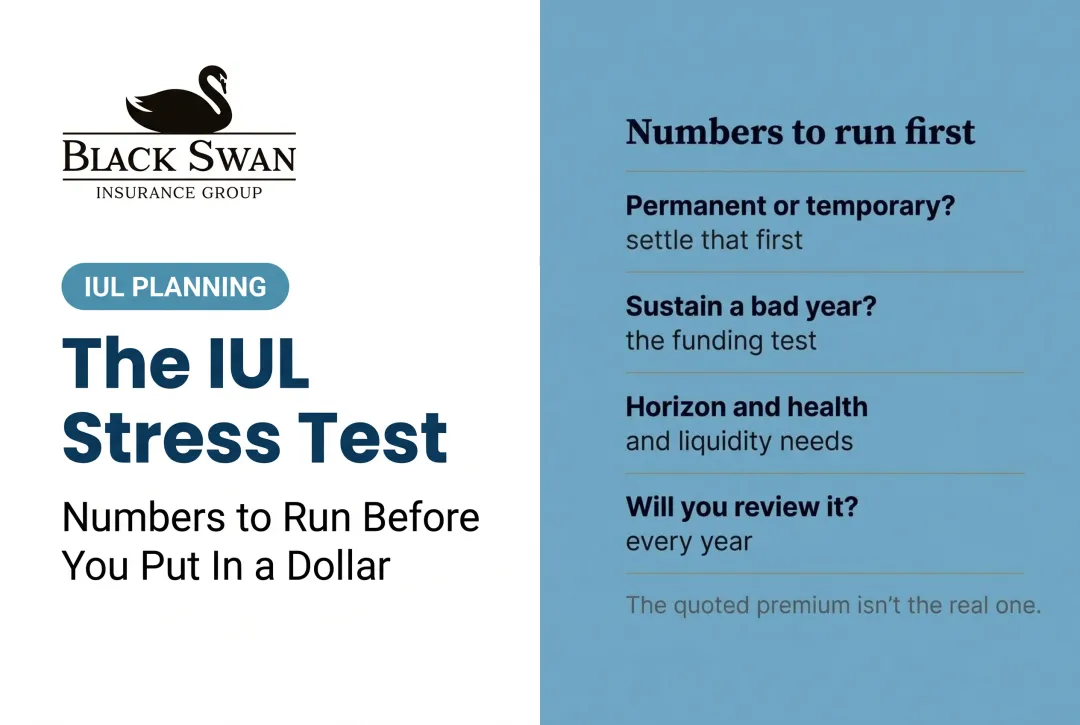
Stress-Testing Before You Sign
Run the illustration through three lenses: guaranteed assumptions, a deliberately conservative crediting assumption, and the carrier's current non-guaranteed assumption. Treat guaranteed as the floor, the lower rate as the sober case, and the current column as upside rather than plan.

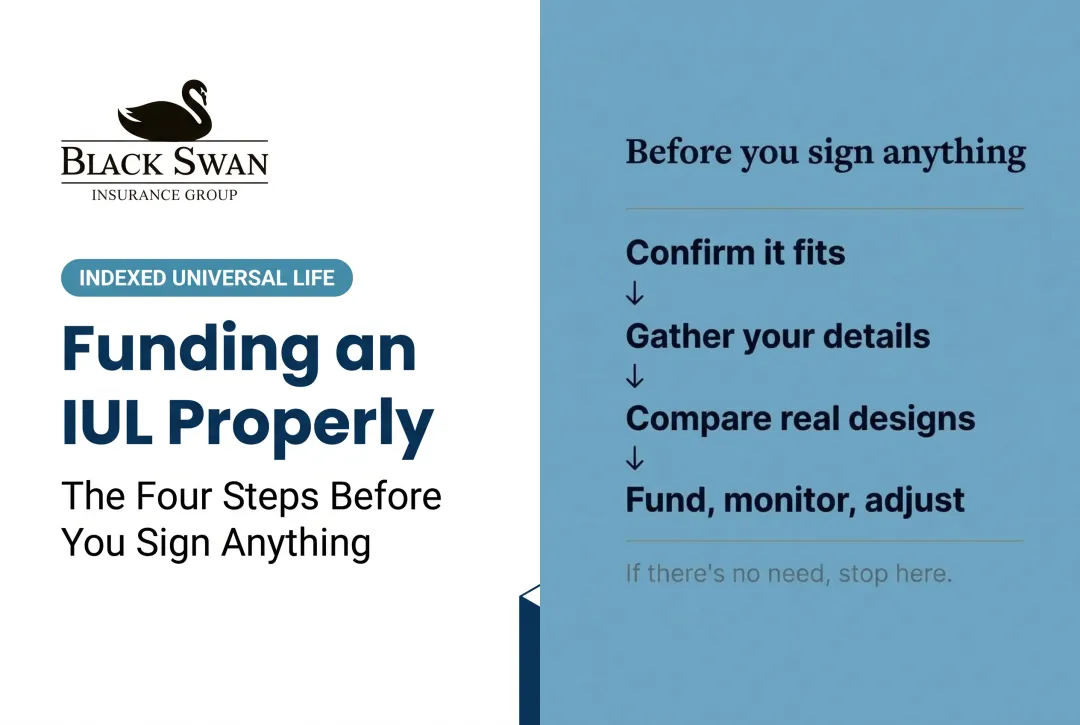
Test Funding Durability
- What happens if premiums are reduced or paused for several years?
- How long does the policy stay in force if cash value alone must cover charges?
- What additional premium is needed if credited rates come in below projection?
- Does the planned premium still fit after emergency reserves, retirement contributions and taxes?
Test the Loans
Policy loans reduce cash value and death benefit while outstanding, and unpaid interest compounds. If the policy lapses with a loan balance and gain in the contract, that balance can become a taxable event with no cash received to pay it.
Confirm the Purpose Matches the Design
A policy built for permanent protection looks different from one built for supplemental income or estate planning. The illustration should follow the stated goal, not the other way round.
Run the Alternatives on the Same Terms
Same contribution schedule, same horizon, against term life plus a diversified investment account, whole life or guaranteed universal life, and simply maxing a 401(k) or Roth IRA first. If the need is temporary protection, term insurance wins that comparison outright and the conversation can end there.
The Ultimate IUL Blueprint
If you are holding an illustration right now, the Blueprint covers exactly what to extract from it: the guaranteed column, the loan provisions, the seven-pay limit, and the scenarios the design has to survive.
Who This Product Fits
Stronger Fit
- A genuine, long-term need for permanent life insurance standing on its own merits
- Household income of $150K+ with stable surplus cash flow beyond other priorities
- Willingness to monitor and fund the contract for years, and to review it annually
- Clear understanding that non-guaranteed values can and do change
- Any potential tax-advantaged access understood as conditional on the policy being properly structured, funded and managed
Weaker Fit
Not everyone should buy an IUL. A compelling illustration is the easiest thing in this business to produce and the weakest reason to buy.
- Inexpensive short-term coverage is what is actually needed — term insurance is the answer
- Guaranteed accumulation with no variability is the goal
- A fully hands-off strategy is the preference
- Income is uncertain or unstable
- Liquidity is likely needed before the contract builds accessible value
Late-start high earners, roughly 45 to 55, face a compressed runway. Insurability, liquidity and whether the policy can realistically stay in force through retirement deserve extra scrutiny, because there is less time to recover from underfunding.
High income alone does not establish suitability. Health, family obligations, business concentration, tax position and pre-retirement liquidity all factor in.
Risks to Understand Before You Sign
- The guaranteed column may show a lapse decades before the current column does, on the same document
- Charges continue in a 0% crediting year, so cash value can fall with the floor intact
- Cost of insurance rises with age and is deducted regardless of index performance
- Caps, participation rates and spreads are non-guaranteed and can be reset at renewal
- Dividends are excluded from index crediting, so it is not comparable to a total-return benchmark
- Surrender charges apply in the early years, exactly when a disappointed buyer wants out
- A funding pause can cost years of projected accumulation and raise lapse risk sharply
- Loan interest compounds, and a lapse with a loan outstanding and gain in the contract can create taxable income
- Crossing the seven-pay limit makes the contract a MEC under I.R.C. § 7702A and changes distribution taxation permanently
Find Out Where You Actually Stand
This starts with the Tax-Free Wealth Blueprint Fit Review. Send us the illustration. If you earn $150K+, we read the guaranteed column against the current one, calculate a genuine internal rate of return, model a funding pause and a future loan, and compare it against term plus diversified savings on identical terms. If it does not fit, we will tell you that too.
Frequently Asked Questions
Is an IUL ever a good idea?
It can fit someone with a genuine permanent protection need, a long horizon and sustainable funding. Suitability comes from comparing both guaranteed and non-guaranteed values against realistic alternatives, not from the projection alone.
How should an IUL be structured?
Balancing death benefit, premium and cash-value goals against policy charges and lapse protection. That requires an approved illustration reviewed by qualified insurance and tax professionals, not a rule of thumb.
What is an in-force illustration and do I need one?
It reflects your policy's actual performance to date rather than the original sales assumptions. If you already own a policy, it is the only document worth making decisions from.
Why does my policy credit less than the index returned?
Caps, participation rates, spreads and averaging methods each create a gap, and dividends paid by companies in the index are typically excluded from the calculation entirely.
Can I compare an illustrated rate to the S&P 500 average?
No, and the comparison is actively misleading. The fair comparison is after-cost cash value against after-cost cash value, not gross market return against an illustrated rate.
Should I buy term instead?
If the requirement is the most death benefit for the lowest premium over a defined period, term is cleaner and cheaper, and it deserves saying before anyone illustrates a permanent policy for you.
Sources
- NAIC — Life Insurance Illustrations Model Regulation (Model 582)
- NAIC — Actuarial Guideline 49-A
- North American Company — Indexed universal life crediting mechanics
- NAIC — Life Insurance
- I.R.C. § 7702A and Rev. Proc. 2008-39 (modified endowment contracts and the seven-pay test)
Disclosure: This article is educational and is not personal tax, legal or investment advice. Indexed universal life is life insurance first. The figures in the worked example are hypothetical and are not a quote, a carrier projection or a promise of results. Actual results depend on policy design, carrier, crediting options, caps, participation rates, expenses, funding and ongoing management. Policy loans and withdrawals may reduce cash value and death benefit and can create tax consequences if the policy lapses or becomes a modified endowment contract. This strategy is not appropriate for everyone. Illustrated values are not guarantees; actual results depend on policy terms, crediting, costs and funding. Consult your own tax, legal and financial professionals for advice specific to your situation.
And remember, it's not what you earn, it's what you keep… enjoy the ride.